
Why Bonds Matter for Your Portfolio

Table of Contents
 A couple of times recently, I’ve encountered people who argue you or I should not invest any part of a portfolio in bonds. Or who argue only a small percentage of a portfolio should go into bonds. Except if we’re retired. Or close to retirement.
But can I challenge that idea? Argue (politely) bonds matter in some cases? And then because it’s pretty obvious to me a number of vocal investors and even investment advisors don’t understand the math? Would it make sense to quantitatively show both how bonds help and hurt? I think so. So let me keep going…
The Big Bond Misunderstanding
I’m not absolutely sure about this. But in discussing with many investors why bonds don’t belong in an investment portfolio, two facts seem to be what “bond haters” focus on.
First fact? That over time, the average return on equities adjusted for inflation equals roughly 7% while the average return on bonds adjusted for inflation equals about 2%.
Note: I calculated these returns using cFireSim.com and Microsoft Excel on August 21, 2023. At that time, the actual average real return of an all-stocks portfolio equaled 6.64%. The actual average real return of an all bonds portfolio equaled 2.14%.
Second fact, that while stock prices and returns swing wildly from year to year, the variability dampens down over time. (This is true.) And this fact is often followed by a half-fact. If you can just hold stocks long enough, you win. (This is often the case but not necessarily true.)
Often if some writer is talking about this “all stocks” strategy, she or he includes a chart that shows how as time passes the annual return on stocks “reverts to the mean.” Or “averages out.” Here’s a crude version of one these charts I whipped up for another blog post, Unreliability of Long-run Stock Market Returns.
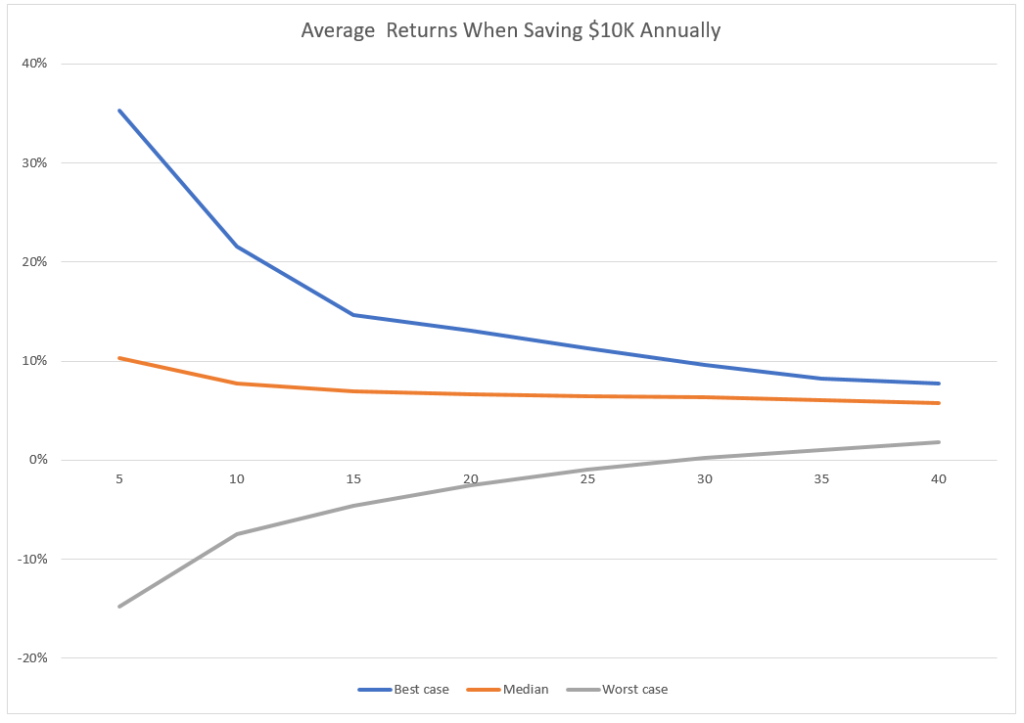
But chart above fosters a misunderstanding: We aren’t guaranteed to earn that better average return on stocks if we just hold on long enough. Yes, you or I will probably get a better result from an all-stocks portfolio. But we won’t for sure “guaranteed” get that. A significant chance also exists we’ll lose money with an all-stocks portfolio as compared to a balanced portfolio that includes stocks and bonds. Or that we’ll more likely run out of money in retirement if we use an all-stocks portfolio.
Because of this reality, some people probably want to include bonds in their portfolios. Who? People willing to trade away the higher upside from stocks and the likely higher average return for dodging some worst-case scenarios.
But Stocks Always Beat Bonds Right?
I’m going to get pretty gritty about the details in a few paragraphs. But before I do that? Let me first show graphically a very recent example where an all stocks portfolio loses compared to a balanced portfolio which holds 70 percent in stocks and 30 percent in U.S. Treasury bonds. Figure 2 below shows a line chart the Portfolio Visualizer Backtest Portfolio tool draws for three example portfolios. The blue line shows a 100 percent allocation to US stocks. The red line shows a 70 percent allocation to US stocks and a 30 allocation to US long treasuries. And the yellow line shows a 100 percent allocation to US long treasuries.
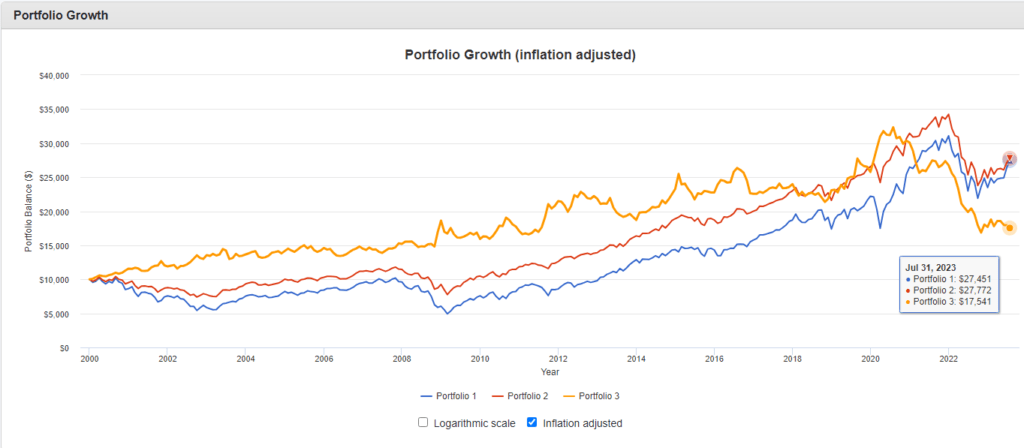
Two observations. First, if you started in 2020, over the next two decades, an all-stocks portfolio (the blue line above) performed more poorly than an all bond portfolio (the yellow line above). The all stocks portfolio only catches up in year 21. (This shows in the chart when the yellow line crosses the blue line.)
Second, even after more than 22 years? A balanced portfolio (the red line) beats the all stocks portfolio (again the blue line). No, you’re right. The all stocks portfolio may be ahead at year 25. Or year 30. (I hope it will be. I’m personally allocating 30 percent to US stocks.) But the line chart shown above doesn’t prove that if you or I just hold stocks long enough, we always win. In fact, it hints the opposite.
Note: If you use US intermediate treasury bonds rather than US long treasury bonds, the all-stocks portfolio looks better. But not much. And the intermediate treasuries still do reduce your downside risk over a couple of decades.
Calculating Downside Protection from Bonds
You can use another Portfolio Visualizer too, its Monte Carlo simulator, to assess example effects of adding bonds to your portfolio. Specifically, you can use that tool to get an idea as to how much upside risk you give away by adding bonds, how the average return probably shrinks by adding bonds, and then how the downsize risk probably lessens by adding bonds.
Just follow these steps, for example, to assess the downside risk avoided by adding bonds:
- Enter https://www.portfoliovisualizer.com/monte-carlo-simulation into your web browser’s address box.
- Set the Cashflows drop-down list box to “No Contributions or Withdrawals.”
- Verify the Simulation Model drop-down list box shows “Historical Returns.”
- Open the Intervals drop-down list box, and select Custom. Portfolio Visualizer adds two new text boxes: Percentile Intervals and Return Intervals.
- Edit the Percentile Intervals values to show 1, 5, 10, 20, 30.
- Set the Asset 1 drop-down list box to “US Stock Market.”
- Enter 100 into the Asset 1 Allocation text box.
- Click Run Simulation.
- Check the Inflation Adjusted box.
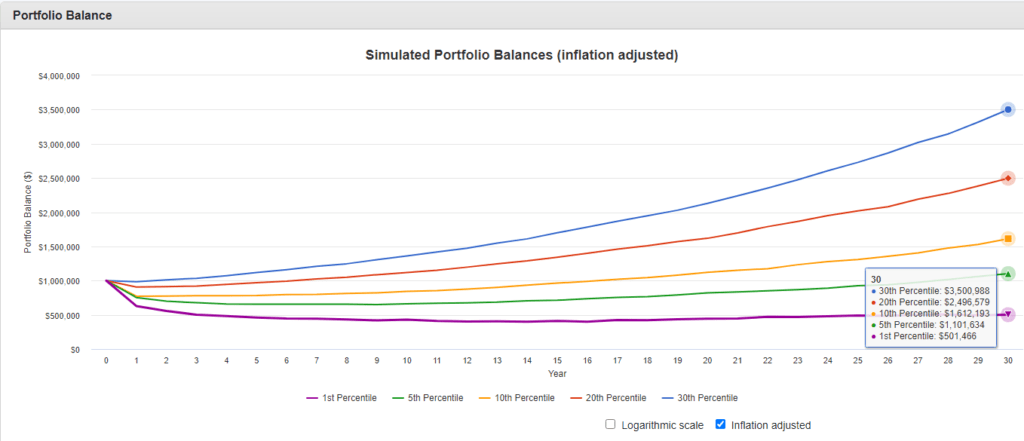
Figure 3 below shows the line chart with the first, fifth, tenth, twentieth and thirtieth percentile outcomes for an all-stocks portfolio based on historical returns. (Click the image to see a larger version of the chart.)
To see what a 70-percent stocks and 30-percent US intermediate treasuries allocation looks like, follow these steps:
- Enter 70 into the Asset 1 Allocation text box.
- Set the Asset 2 drop-down list box to “Intermediate Term Treasury”.
- Enter 30 into the Asset 2 Allocation text box.
- Click Run Simulation.
- Check the Inflation Adjusted box.
Figure 4 below shows the line chart with first, fifth, tenth, twentieth and thirtieth percentile outcomes based with an balanced portfolio generating historical returns
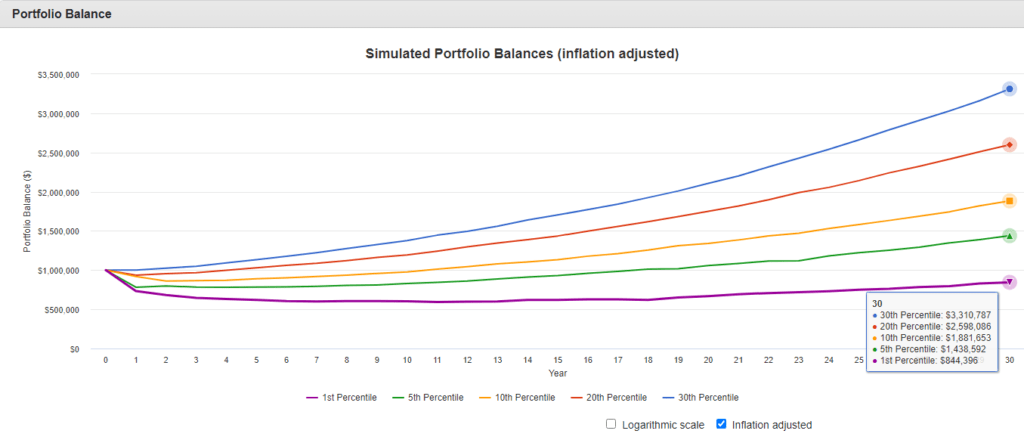
The big thing to note: The all-stocks portfolio’s worst-case scenarios? They’re worse, much worse, that the those that occur for a balanced portfolio.
The “Do Bonds Matter” Simulation Summarized in a Table
The line charts in Figures 3 and 4 make it hard to see precise numbers. But the table below shows the ending values from the two simulations to make comparisons easier.
| Percentile | 100 % Stocks Ending Value |
70 % Stocks 30 % Bonds Ending Value |
| 1st | $501,466 | $844,396 |
| 5th | $1,101,634 | $1,438,592 |
| 10th | $1,612,193 | $1,881,653 |
| 20th | $2,496,579 | $2,598,086 |
| 30th | $3,500,988 | $3,310,787 |
Let me specifically call out four observations.
First observation, the calculations above don’t show actual three-decade long returns for the two portfolios. Not enough unique thirty-year historical outcomes “exist”. Thus, the simulation uses historical returns as the inputs to 10,000 different simulations. (The first percentile shows the average of the worst 100 simulations.) Also, note that if you run your own simulations using a starting value of $1,000,000, you’ll get slightly different ending values. That’s the nature of the simulation.
Second, the risk minimization you get with bonds? You see that by comparing the first percentile, fifth percentile, and tenth percentile ending values. In all those cases, the worst-case balanced portfolio investor ends up with—per the simulation—a few hundred thousand dollars ahead of the worst-case all-stocks investor. That’s the example benefit of adding bonds. Again, note that the investor in this simulation started with $1,000,000.
Third, somewhere between the 20th and 30th percentiles, the all-stocks portfolio beats the balanced portfolio. That makes sense. Most of the time, an all-stocks portfolio gives you a better return. That’s why you and I want to hold as large a percentage in stocks as we can. Especially early on in our saving.
Fourth, you probably ought to go back and redo your simulations so you can see how well the 50th percentile, the 75th percentile and 90th percentile investors do too. Those investors make out like bandits by loading up on equities.
Just So There’s Not a Misunderstanding
To close, four tangential remarks about this “bonds matter” argument.
First, I’m not arguing everyone should load up on bonds. Rather, I’m trying to show quantitatively how bonds can reduce your downside risk.
Second, for what it’s worth, I’m thinking a modest allocation to bonds. Something like 30 percent. (That’s my actual allocation.) Or 20 percent. Or maybe 40 percent.
Third, I think we follow the suggestion of former Yale endowment fund Chief Investment Officer David Swensen and use U.S. Treasury Bonds and Inflation Protected Securities. (This suggestion from Swensen’s classic book, “Unconventional Success.“)
Fourth, let me reference a couple of related blog posts. You might want to peek at our Unreliability of Long Run Stock Market Returns blog post because it includes a full discussion of that “just be patient everything evens out” line chart that people commonly misinterpret. And you might also want to look at another article here: Rate of Return of Everything Line Charts. That blog post may be worth skimming too to get a good visual sense of the variability of stock market returns in different countries and over the last 150 years.