
24+ KPIs and Tips To Track Performance

Table of Contents
For most companies, contact centers are an extension of the business. As such, the need to measure and improve call center performance is critical. But which key performance indicators (KPIs) should you track?
By knowing which contact center metrics to focus on and how to use the data to improve performance, you can find ways to improve and coach call center agents to achieve bigger and better results.
Our guide breaks down the top 25 call center metrics you need to track and explains how to use them to improve your customer experience.
What Are Call Center Metrics?
Call center metrics are standard measurements used to assess the performance of a contact center. In many cases, businesses use call center analytics platforms to track these data.
These metrics may be used by call center managers to look for ways to improve the customer experience and agent efficiency. Over time, these metrics have evolved to keep pace with call center industry trends and customer feedback.
Why Are Call Center Metrics Important?
Call center metrics are essential, as they allow you to choose KPIs to monitor when assessing your call center’s performance. Therefore, tracking these metrics is a call center best practice.
Since call centers act, in many ways, as the face or voice of their clients’ brands, these metrics are vital to track. You can spot potential issues that may lead to a poor customer experience and, thus, high churn.
By resolving these issues or optimizing what’s working, you can ensure that customers have a better experience and are more likely to stick around.
You may look at your call center metrics and realize that your First Contact Resolution (FCR) rate is low, meaning that many customers have to call back at least a second time to find a resolution to their problem.
By enabling agents to offer solutions sooner in the process, your FCR rate goes up, as does your customer satisfaction rate. And since callers are having their problems resolved sooner, they don’t have to call back as often, meaning the phone lines are freed up and wait times are shorter for everyone else.
Top Call Center KPIs and Metrics To Monitor
There are 25 call center metrics that agencies need to monitor. They fall under three categories:
I. Customer experience metrics
Customer experience metrics help you assess the ease of getting help from your company and the resulting customer satisfaction.
These metrics are essential because high scores can indicate satisfied customers who are less likely to churn. Use these call center KPIs to look for opportunities to improve the customer journey:
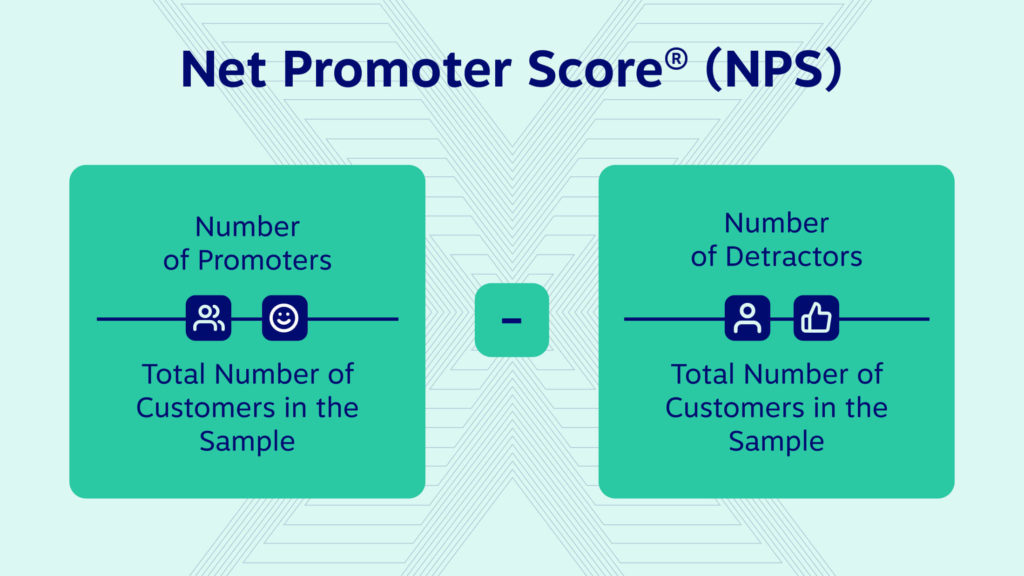
Net Promoter Score (NPS®)
The NPS is perhaps the most accurate measure of how much your customers love your brand. There’s some math involved here, but it relies on this straightforward question: “On a scale of 0–10, how likely are you to recommend our company to your friends and peers?”
Promoters are customers who give scores of 9–10, while passives are 7–8 and detractors 0–6, respectively.
Formula: (Number of Promoters ÷ Total Number of Customers in the Sample) − (Number of Detractors ÷ Total Number of Customers in the Sample)
Customer Satisfaction (CSAT)
CSAT provides insight into the average customer experience and satisfaction rates. Consider this metric part of your quality assurance system.
Ordinarily, companies ask for customer feedback on whether an agent has adequately solved an issue. CSAT scores are the most direct way to determine the customer’s perception of the support they received.
Based on an arbitrary scoring system, companies classify responses into sentiments such as the following:
- Very satisfied
- Satisfied
- Not satisfied
- Very dissatisfied
Formula: (Number of Satisfied Customers / Number of Survey Responses)
The final customer satisfaction score is the ratio of very satisfied and satisfied to the total number of survey respondents.
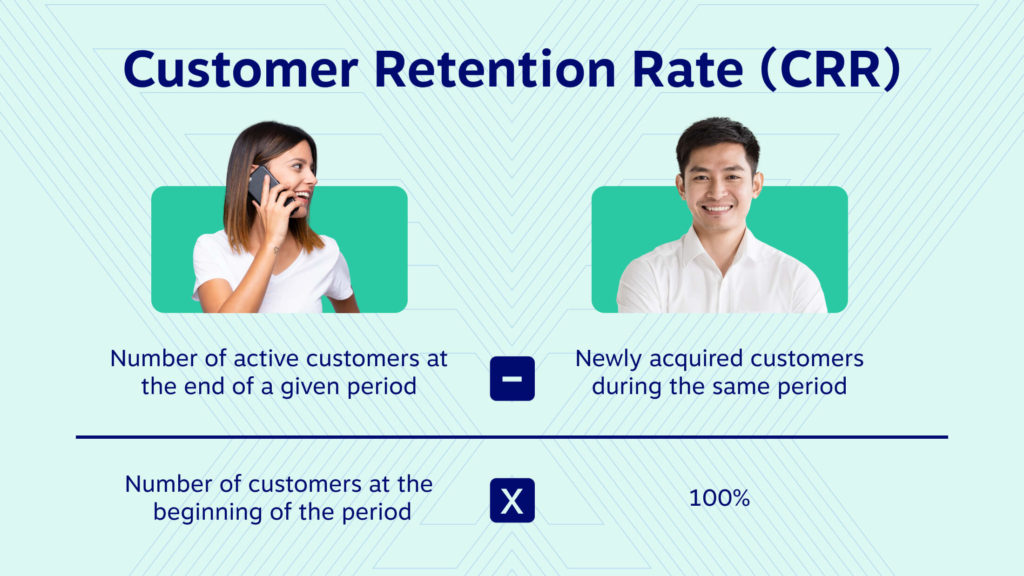
Customer Retention Rate (CRR)
CRR measures the percentage of existing customers who remain customers within a given time period. Customer support is directly tied to retention rates.
Formula: (Number of Active Customers at the End of a Given Period − Newly Acquired Customers During the Same Period) ÷ Number of Customers at the Beginning of the Period × 100%
The period can be 30 days, 90 days, 360 days, or some other value.
First Response Time (FRT)
FRT tells you how long it takes customers on average to reach a qualified agent after making a phone call or initiating contact.
Today’s customers are masters of instant gratification and dislike waiting, so keep this metric to a minimum.
Formula: Total Wait Time for All Calls ÷ Total Number of Calls
First Contact Resolution (FCR)
FCR tells you how often your agents are able to resolve customer issues within the first customer call.
Solving issues fast without requiring callbacks creates a positive customer experience, and it can help you assess call center success and agent efficiency. Your agents should be able to quickly identify and address customer needs to increase this metric.
Formula: Total Number of Reported Issues Resolved on First Call ÷ Total Number of First Calls
Note: As an indicator of excellent call quality, this metric is also called the First Call Resolution Rate.
Customer Effort Score (CES)
CES indicates how easy it was for your customer support team to meet a customer’s needs or solve their problems. While there’s no standard system for measuring CES, many companies use scales ranging from five to seven points.
Regardless, CES generally uses a single question similar to the following: “On a scale of 1–7 (where 7 stands for strongly agree and 1 for strongly disagree), did the service make it easier for you to solve your problem?”
The higher the score, the better.
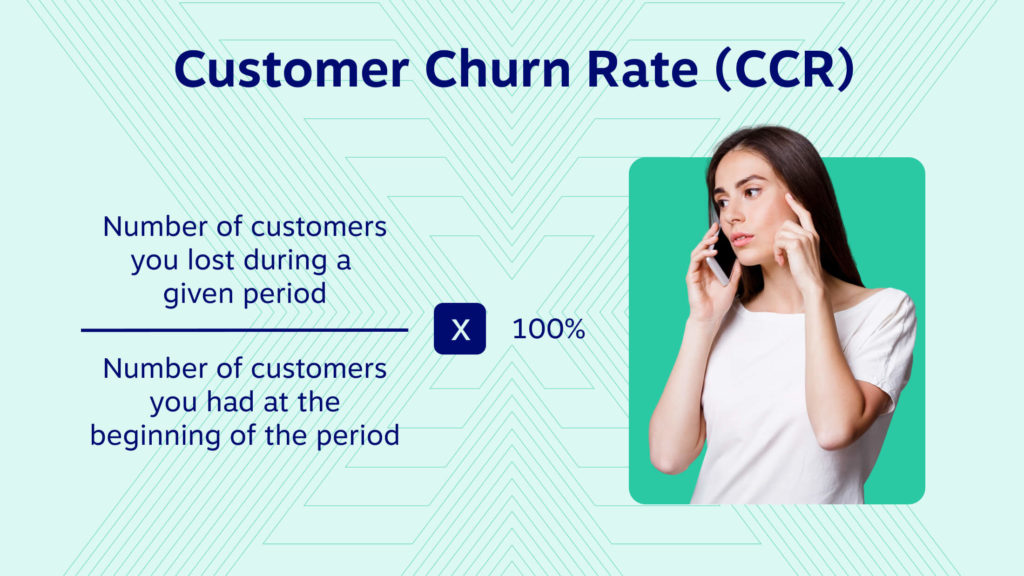
Customer Churn Rate (CCR)
CCR is the reverse of the retention rate. It tells you how many customers you lost during a set time frame. And while many factors may impact churn (including product satisfaction or product pricing), customer support and call center experience often play an important role.
Formula: (Number of Customers Lost During a Given Period ÷ Number of Customers at the Beginning of the Period) × 100
Channel Mix
This metric tells you how many service channels you’re offering because it isn’t just about phone calls. Channels may include:
- Phone calls
- SMS messaging
- Social media messaging
- Emails
- Live messaging or chat apps
- Online self-service sites (including FAQs and DIY videos)
To compute this metric, calculate the total number of customer service sessions per channel.
II. Agent performance metrics
Improving individual call center agent performance is a common call center strategy. When you’re fully leveraging each staffing asset, your entire organization becomes more productive and efficient.
These are the agent performance metrics that you should monitor:
Adherence to Schedule
This metric indicates how much time an agent spends handling customer calls. A low schedule adherence score contributes to an increase in missed and abandoned call rates. These, in turn, can negatively impact your CSAT and NPS.
Formula: (Number of Hours Agents Spend Handling Calls + Net Available Time) ÷ Paid Hours × 100
Agent Utilization Rate
Agent Utilization Rate is the average amount of time an agent spends handling calls in a given period relative to the total number of work hours.
For example, an agent who works an average of five hours in an eight-hour workday has a utilization rate of 62.5%.
Like Adherence to Schedule, this metric is also considered a good indicator of agent performance.
Formula: (Average Number of Handled Calls × Average Handle Time) ÷ Total Work Hours in a Given Period × 100
Agent Attrition Rate
This metric shows the pace at which a call center’s agents resign or retire. High agent attrition rates can result in staffing issues and erode a call center’s ability to serve its customers adequately.
Formula: (Number of Employees Who Left During a Given Period) ÷ Average Number of Employees for the Period × 100%
Occupancy Rate
Occupancy Rate measures the time call center agents spend engaging customers on live calls and doing admin tasks related to those calls. Low Occupancy Rates may be due to duties that are not call-related, longer breaks, the frequency of meetings/events/training sessions, or poor agent work habits.
Formula: (Total Contact Handling Time ÷ Total Logged Time) × 100
Average Speed of Answer (ASA)
ASA calculates the average time to answer customer calls. Some organizations equate this metric with FRT. Both of these time-based quantities set an ideal threshold to respond to customer calls.
Formula: Total Wait Time for Answered Calls ÷ Total Number of Answered Calls
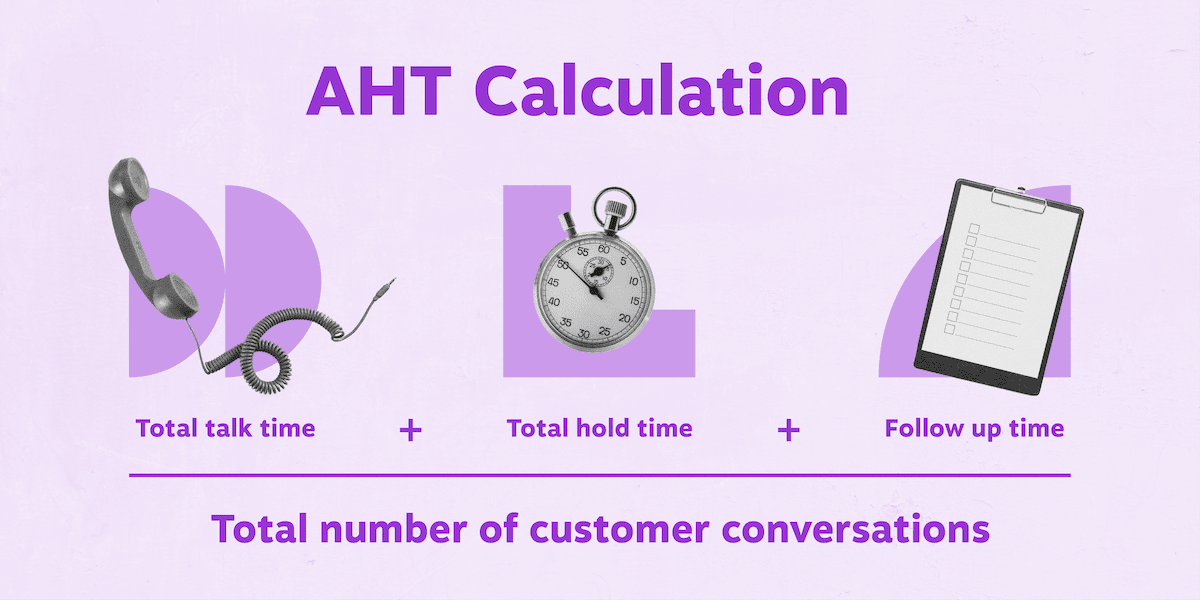
Average Handle Time (AHT)
AHT is the average amount of time an agent takes to handle a call from start to finish. It includes hold times and after-call tasks. You can use this metric to set team benchmarks and discern which agents need further training to handle customer calls.
Formula: (Total Talk Time + Total Hold Time + Total After-Call Work Time) ÷ Total Number of Calls
Average After-Call Work Time
This metric refers to the time agents take to finish tasks related to a call after it has ended. High values for this after-call work function suggest inefficiency on the part of the agent, workflow, or call center tools.
Formula: (Total Time To Finish All Post-Call Tasks) ÷ (Total Number of Calls)
III. Call center performance metrics
Call center performance metrics track the performance of your contact center overall within a given period of time. Improving your call center performance metrics may reduce costs, increase profits, and enable you to deliver stronger results for your clients.
Cost Per Call (CPC)
CPC refers to the average cost incurred by a contact center for each phone call it handles. This metric shows how much it costs a call center to run its operations. It also gives insight into whether a call center is operating cost-efficiently and allocating its resources well.
Companies commonly set an ideal CPC and work to achieve and maintain this threshold.
Formula: Total Cost of All Calls ÷ Total Number of Calls
Note: Total Cost of All Calls might refer to operating expenses in some companies.
Service Level
Service Level is a reliable indicator of overall call center health. It measures the center’s capacity to answer incoming calls with an accepted threshold for hold time and arrival rates.
Most companies set their ideal Service Level around cost efficiency. For example, a company might aim to answer at least 80% of all inbound calls within 20 seconds. It is then upon the call center to meet this Service Level with agent training, process improvement, and tech improvements.
Formula: (Number of Calls Answered in Y seconds ÷ Total Calls Received) × 100
Call Volume
This is all incoming and outgoing calls handled by the call center in a given period. Many organizations group call volume into two categories:
- Total call volume handled by an agent
- Total calls handled by an automated system (such as an IVR)
This metric can be calculated by tracking the total number of calls received by your contact center within a set time.
Peak Hour Traffic
This metric identifies the specific times of the day with higher call volumes. Knowing Peak Hour Traffic helps companies allocate adequate resources to handle call volume increases.
Using call center analytics software can automatically provide insight into this metric and can help you track peak call times across different days.
It’s also a good idea to monitor the transfer rate to spot any unusual call patterns or drivers for misdirected calls.
Average Waiting Time
This metric relates to instances where agents need to place customer calls on hold. While there are legitimate reasons for holding calls, contact centers should always minimize Average Waiting Time.
Formula: Total Number of Seconds Customers Spend Waiting ÷ Total Number of Calls
Call Abandonment Rate
Customers generally want their issues resolved quickly, and many hang up when kept on hold for too long. Abandoned calls signal customer frustration and a potential loss of trust in your brand.
Formula: (Number of Calls − Number of Handled Calls) ÷ Number of Calls × 100
Repeat Calls
Related to FCR, this metric shows types of problems that are difficult to resolve in the first call they are reported.
Workarounds include self-service solutions and additional agent training. When these are ineffective, content on your website and social media must show common solutions.
Audit your inbound call logs to identify the quantity of calls coming in from the same phone number.
Longest Hold Time Rate
This is the longest time a customer call was on hold without the customer abandoning the call.
The longest hold time might not be relevant for every customer, but it means at least one caller was on hold that long. Ensuring agents are mindful of their call lengths helps keep this figure to a minimum.
Callback Messaging
This metric refers to the number of callback requests from customers who’d rather avoid long holding times.
Because most customers want to resolve their issues immediately, keeping this metric to a minimum is ideal. Consider this number in context to other call center metrics to determine if this is a predictive indicator of customer satisfaction.
Average Time in Queue
This is the average time a caller spends waiting to speak to an agent. Average Time in Queue refers to the time a caller spends on hold before they are connected with the agent for the first time. It’s important to keep the queue time as short as possible.
Formula: Total Time Callers Waited in the Queue ÷ Number of Answered Calls
Best Practices To Improve Call Center Metrics
Monitoring your call center metrics is the first step. Knowing how to leverage that data to improve contact center performance is the next.
These call center strategies can help you improve call center metrics and performance:
- Identify areas for improvement: No call center is perfect, and there’s always room for improvement. Look at the metrics that are lower than industry standards and consider which ones are most directly impacting customer loyalty.
- Set goals and targets for each metric: It’s not enough to say, “I want to improve the customer experience.” Be specific. Decide, for example, that you want to decrease missed calls by 10% month over month and that you want to see customers’ average time in the queue drop by two minutes each. Once you have specific goals, you can start putting plans in place to reach them.
- Track your progress over time: Plenty can change in your organization, including call center strategies, agent scripts, and even staffing policies. Evaluate your progress over time, considering these changes to determine what’s helping (and what isn’t). Tools such as Nextiva Call Analytics can help you monitor all your call center KPIs.
- Implement changes and measure the impact: When you’ve determined what needs to be changed, find a way to implement new policies and measure them carefully. For example, you might offer additional training to agents who struggle to handle their call volumes, or you can find callback or follow-up solutions to minimize abandoned call rates.
- Create an omnichannel customer experience: Customers want to interact with businesses using their preferred communication methods. Choosing call center phone systems that include options for SMS messaging and even video conferencing can deliver customer excellence as a result.
Call Center Metrics Analytics and Reporting
Call center monitoring is critical to evaluate everything from the quality of customer support to agent productivity and efficiency.
The right call center technology can help, especially if it has a built-in analytics offering.
Nextiva’s call center solutions come with an analytics add-on that offers the following:
- Performance metrics, including total calls, total talk time, and total number of inbound calls
- Reporting templates to measure activity across your organization, including for individual employees
- Call reporting metrics, including the number of answered calls compared to the number of missed or abandoned calls or incoming calls vs. outbound calls
Our analytics are fully integrated with our virtual call center software, allowing you to collect data in real time while your team works hard to deliver outstanding customer support. Nextiva also integrates with popular CRMs, streamlining data synching across multiple platforms.
Knowing which KPIs to track — and what your call center’s standard benchmarks are — ensures that you’re delivering the best customer experience possible.
Nextiva can help you track the essential call center KPIs to optimize performance. Book a demo of our analytics software here.